MAIN WINDOW – OVERVIEW
Once the data has been downloaded (see: how to start) (or the project has been loaded), the main window will look like this:
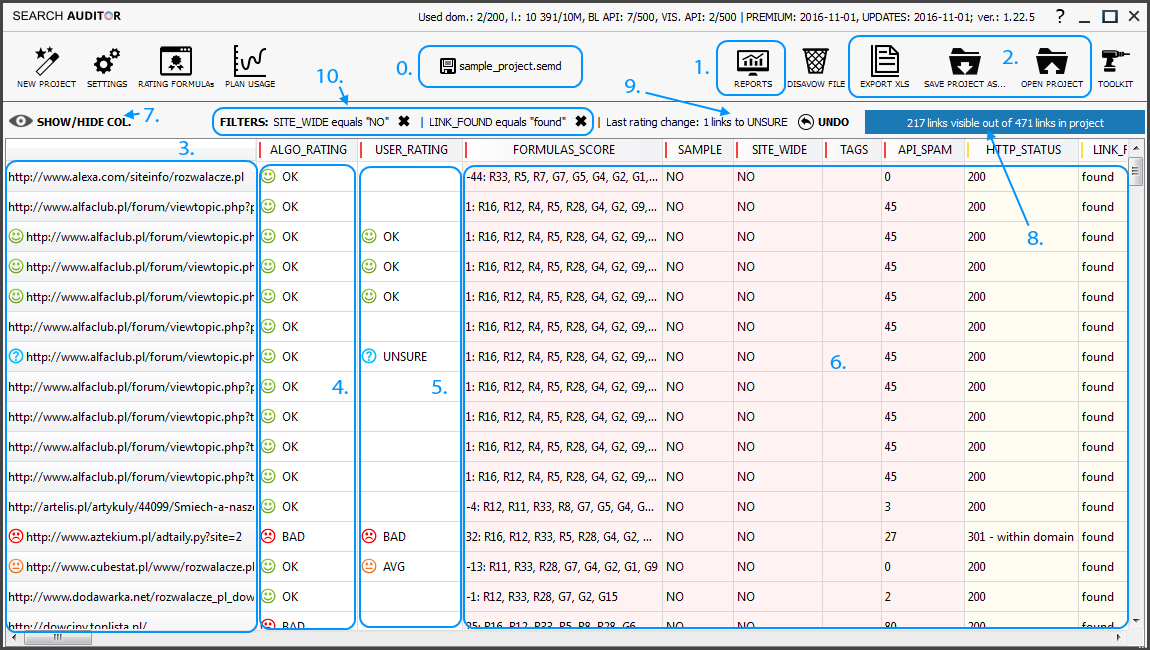
It can be divided into basic functional groups:
0. Quick save.
1. Main tabs: Link analytics (gathered/loaded data), Reports – aggregates/charts based on downloaded data, Saved projects/saved reports – previously saved data.
2. Data exports and general reports: Disavow file generator, Exports.
3. List of analysed links
4. Algorithmic links rating (OK/AVG/BAD/DEAD) which can be translated into disavow file or used for other purposes.
5. User’s rating (OK/AVG/BAD/UNSURE) – superior to ALGO_RATING (if entered by user).
6. Evaluated parameters.
7. Column visibility settings.
8. How many links are currently visible (for filtering purposes).
9. USER_RATING changelog (and easy undo).
10. Active data filters (and easy undo “X”).
SOME HINTS:
Move mouse cursor over the link to see the full address. Double click to open it in your browser.

Don’t remember the interpretation of a param? Move mouse over the header to see explaination.

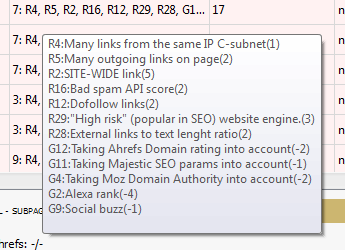
Some params have useful hints as well. Let’s take a quick insight into formulas matched for a link:
VISIBLE COLUMNS
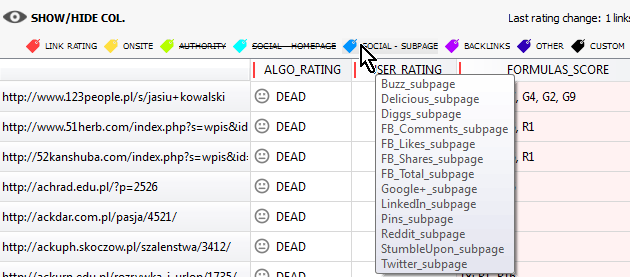
You can quickly turn on/off groups of columns by clicking the colour tag below the main table. Move mouse cursor over the tag to see which columns belong to the group:
Click “CUSTOM” tag to determine your own settings:
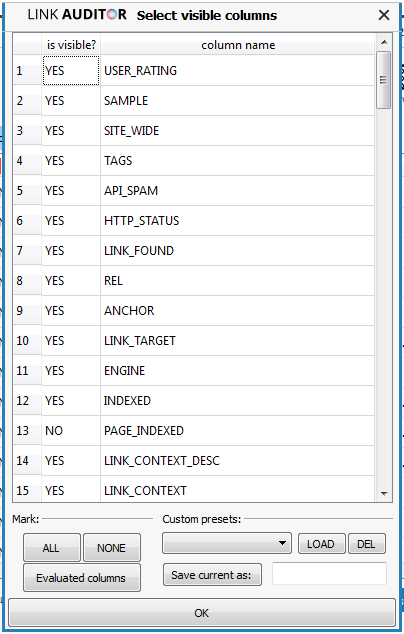
You can easily mark all columns/no columns/all columns evaluated in project as well as define your own presets!
SORTING, DATA FILTERS
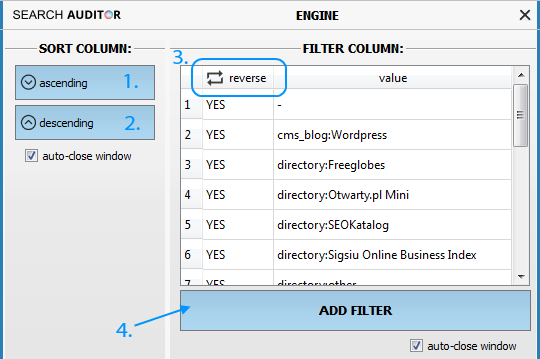
Just click on column header to get to data filters! Use (1.) or (2.) to quickly sort column.
Want to filter data? Depending on the data type, you will have some different possibilities. In the example, “ENGINE” filters have been filled with all the values that occur in current project. Press (3.) to quickly invert selection.
(4.) to add new condition!
After you have added a new condition, it is listed in the filters set. You can quickly activate/deactivate conditions by clicking “YES/NO” in the “active” column. Use “Activate filters set” to filter the main table and “Show all data” to quicklu omit filters (and see all links again). Filter sets can be saved to a file and loaded in the future!
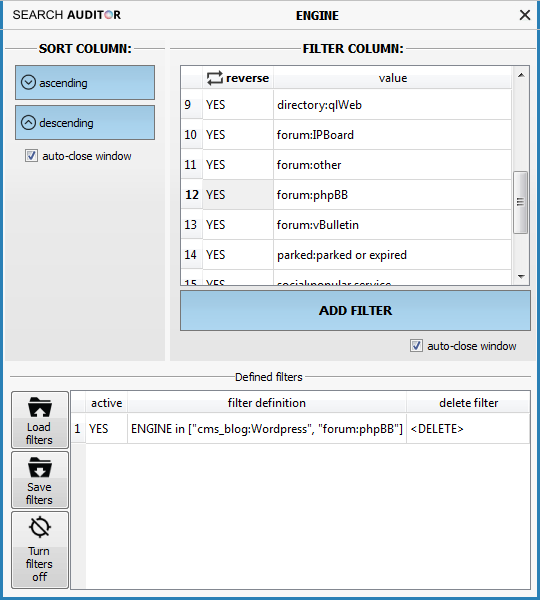
Active filters are visible at the bottom of the window (where you can easily delete them):

(CHANGING) RATINGS
Clusteric Link Auditor classifies links into three main groups: OK, AVG, BAD and DEAD links (classification is based on the overall formulas score). In some cases you may disagree with automatic rating.
Changing rating for a single link is as simple as it can be – you can enter USER_RATING and change it with simple mouse clicks.
Just click on the icon to change classification:
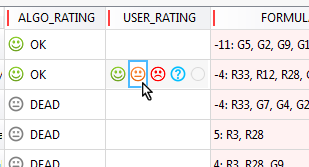
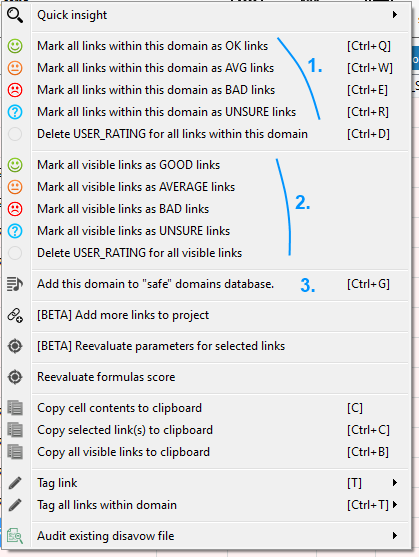
To update rating for more links at once, please use context menu:
You can:
(1.) Change rating for all links within domain.
(2.) Change rating for all visible links (e.g. after filtering data).
(3.) Add domain to “safe domains” list. Clusteric Link Auditor will remember this domain as “trusted”, which means it will always be marked as “OK” in future projects (despite the formulas score!). Use this option to secure your own domains/blogs/other valuable domains.
TAGS/COMMENTS
To tag/comment link, select an appropriate option from context menu:

Now enter the new comment to make it appear in “TAGS” column:

To make work easier, recently entered comments can be added straight from context menu:

You can also comment all links within domain at a time.
ADDING NEW LINKS TO PROJECT AND REEVALUATION
Link Auditor helps you to keep your project up to date.
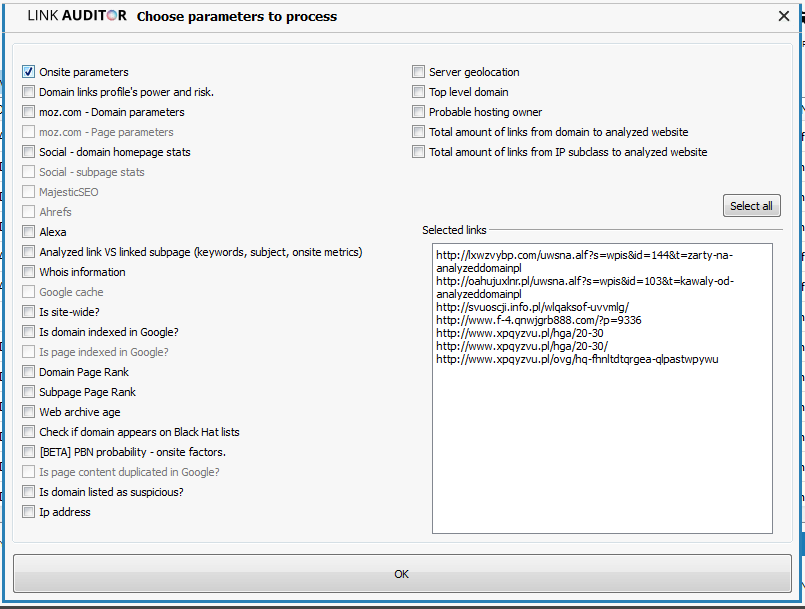
You can easily add more (fresh links?) links to project or reealuate parameters for selected links.
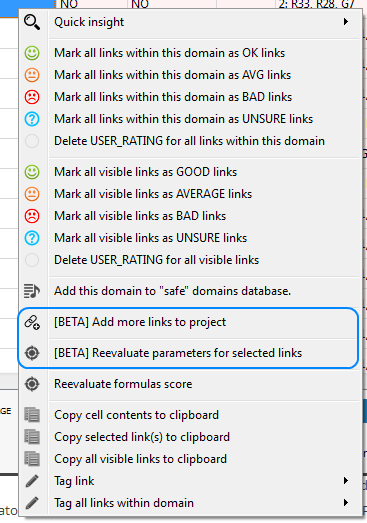
When reevaluating params, you can choose which params to refresh. For instance, you have sent a removal request for some links and want to check if they really disappeared, which means, you want to reevaluate onsite factors (below).
